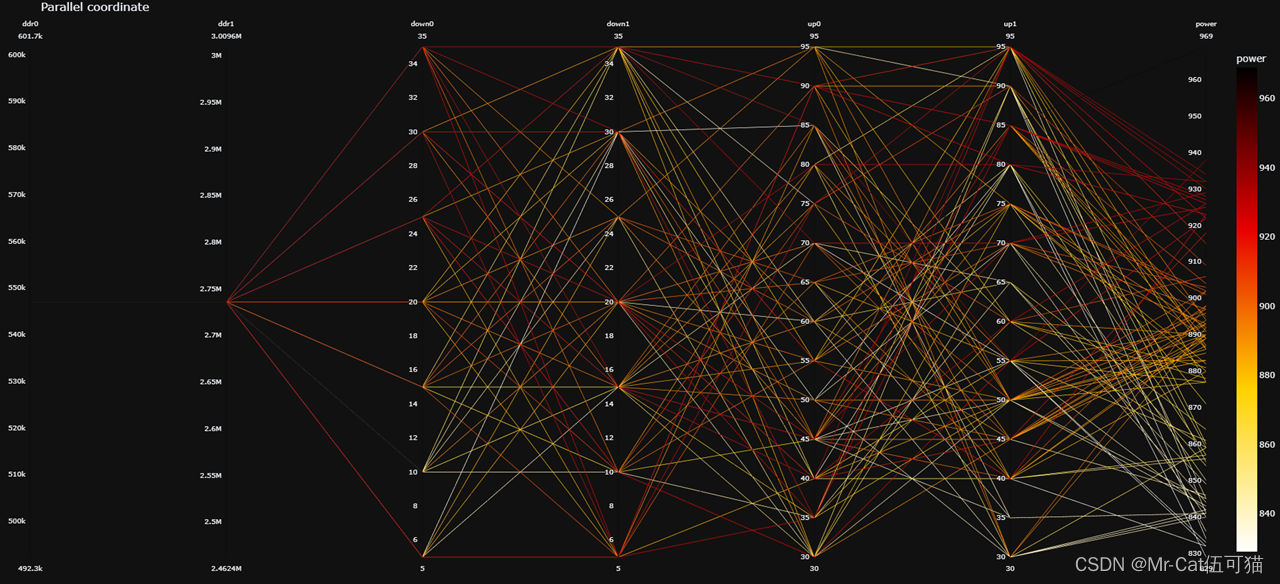
plotly parallel_coordinates平行坐标可视化
使用plotly画平行坐标图,代码如下:
其中数据使用excel的csv格式(当然可以使用其它格式),csv的标头是参数名。
import plotly.express as px
import numpy as np
import pandas as pd


# df = px.data.iris()
df = pd.read_csv("https://raw.githubusercontent.com/bcdunbar/datasets/master/iris.csv")
print(df)
fig = px.parallel_coordinates(df, color="species_id", labels={"species_id": "Species",
                "sepal_width": "Sepal Width", "sepal_length": "Sepal Length",
                "petal_width": "Petal Width", "petal_length": "Petal Length", },
                             color_continuous_scale=px.colors.diverging.Tealrose,
                             color_continuous_midpoint=2)
fig.show()

其中上面的代码参数,如颜色等是可以修改的
颜色的修改可以看这个博文
颜色一共包含:
cs=['aggrnyl', 'agsunset', 'algae', 'amp', 'armyrose',

    'balance', 'blackbody', 'bluered', 'blues', 'blugrn',

    'bluyl', 'brbg', 'brwnyl', 'bugn', 'bupu', 'burg',

    'burgyl', 'cividis', 'curl', 'darkmint', 'deep',

    'delta', 'dense', 'earth', 'edge', 'electric',

    'emrld', 'fall', 'geyser', 'gnbu', 'gray', 'greens',

    'greys', 'haline', 'hot', 'hsv', 'ice', 'icefire',

    'inferno', 'jet', 'magenta', 'magma', 'matter',

    'mint', 'mrybm', 'mygbm', 'oranges', 'orrd', 'oryel',

    'peach', 'phase', 'picnic', 'pinkyl', 'piyg','plasma',

    'plotly3', 'portland', 'prgn', 'pubu', 'pubugn',

    'puor', 'purd', 'purp', 'purples', 'purpor',

    'rainbow', 'rdbu', 'rdgy', 'rdpu', 'rdylbu',

    'rdylgn', 'redor', 'reds', 'solar', 'spectral',

    'speed', 'sunset', 'sunsetdark', 'teal', 'tealgrn',

    'tealrose', 'tempo', 'temps', 'thermal', 'tropic',

    'turbid', 'twilight', 'viridis', 'ylgn', 'ylgnbu', 'ylorbr', 'ylorrd']
在上面的颜色名后面加_r可以把颜色反转,如hot_r
修改颜色的实例如下:
df = pd.read_csv("./data/face/data_random_choice_day/data1.csv")
fig = px.parallel_coordinates(df, color="power", dimensions=['ddr0','ddr1','down0','down1','up0','up1','power'],
                            #  color_continuous_scale=px.colors.diverging.hot,
                            color_continuous_scale='hot_r',
                             color_continuous_midpoint=10,
                             range_color=[min(df['power']),max(df['power'])], #颜色范围
                             title='Parallel coordinate',  # 图名字
                             template='plotly_dark') #背景使用黑色
fig.show()

