Automatic Exposure Correction of Consumer Photographs 分析
文章目录
- Automatic Exposure Correction of Consumer Photographs
- 1. 图像分割
- 2. 按灰度区域合并
- 3. 根据细节多少和各zone相对对比度约束,求解每个zone对应的 最优zone.
- 4. 每个zone以及对应的最有zone找到之后,可以求解多项式curve的 ϕ s \phi_s ϕs 和 ϕ h \phi_h ϕh
- 5. 关于curve
- 5.1 f Δ ( x ) f_{\Delta}(x) fΔ(x) 和 f Δ ( 1 − x ) f_{\Delta}(1-x) fΔ(1−x)
- 5.2 f ( x ) f(x) f(x)
- 5.3 通过多组lut曲线apply到图像,然后计算图像的细节量,根据图像细节量和人的感观选择合适的lut
- 6. detail_preserve 方法
Automatic Exposure Correction of Consumer Photographs
1. 图像分割
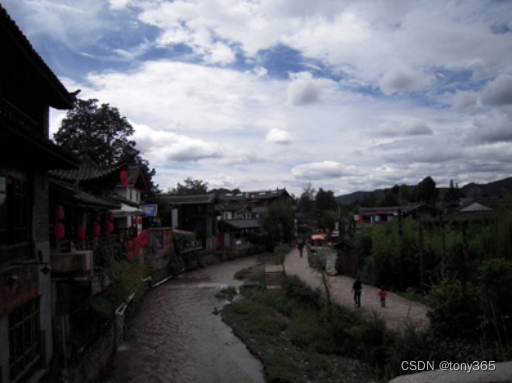
原图:
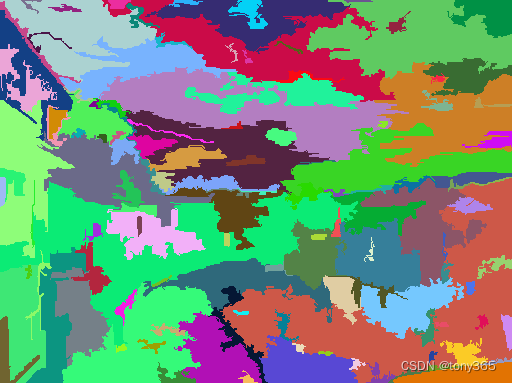
图分割算法:
分为129块, 129个颜色表示每一块
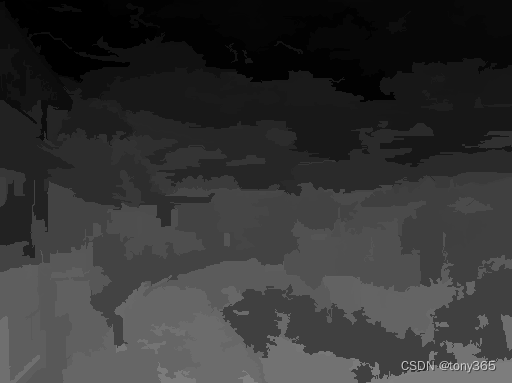
129块分别用 灰度0,1,2,3… 128表示
原理参考: code
主函数如下可以得到上面的两张图。
import cv2
import imageio
from scipy import ndimage
import matplotlib.pyplot as plt
from filter import *
from segment_graph import *
import time


# --------------------------------------------------------------------------------
# Segment an image:
# Returns a color image representing the segmentation.
#
# Inputs:
#           in_image: image to segment.
#           sigma: to smooth the image.
#           k: constant for threshold function.
#           min_size: minimum component size (enforced by post-processing stage).
#
# Returns:
#           num_ccs: number of connected components in the segmentation.
# --------------------------------------------------------------------------------
def segment(in_image, sigma, k, min_size):
    start_time = time.time()
    height, width, band = in_image.shape
    print("Height:  " + str(height))
    print("Width:   " + str(width))
    smooth_red_band = smooth(in_image[:, :, 0], sigma)
    smooth_green_band = smooth(in_image[:, :, 1], sigma)
    smooth_blue_band = smooth(in_image[:, :, 2], sigma)

    # build graph
    edges_size = width * height * 4
    edges = np.zeros(shape=(edges_size, 3), dtype=object)
    num = 0
    for y in range(height):
        for x in range(width):
            if x < width - 1:
                edges[num, 0] = int(y * width + x)
                edges[num, 1] = int(y * width + (x + 1))
                edges[num, 2] = diff(smooth_red_band, smooth_green_band, smooth_blue_band, x, y, x + 1, y)
                num += 1
            if y < height - 1:
                edges[num, 0] = int(y * width + x)
                edges[num, 1] = int((y + 1) * width + x)
                edges[num, 2] = diff(smooth_red_band, smooth_green_band, smooth_blue_band, x, y, x, y + 1)
                num += 1

            if (x < width - 1) and (y < height - 2):
                edges[num, 0] = int(y * width + x)
                edges[num, 1] = int((y + 1) * width + (x + 1))
                edges[num, 2] = diff(smooth_red_band, smooth_green_band, smooth_blue_band, x, y, x + 1, y + 1)
                num += 1

            if (x < width - 1) and (y > 0):
                edges[num, 0] = int(y * width + x)
                edges[num, 1] = int((y - 1) * width + (x + 1))
                edges[num, 2] = diff(smooth_red_band, smooth_green_band, smooth_blue_band, x, y, x + 1, y - 1)
                num += 1
    # Segment
    u = segment_graph(width * height, num, edges, k)

    # post process small components
    for i in range(num):
        a = u.find(edges[i, 0])
        b = u.find(edges[i, 1])
        if (a != b) and ((u.size(a) < min_size) or (u.size(b) < min_size)):
            u.join(a, b)

    num_cc = u.num_sets()
    output = np.zeros(shape=(height, width, 3), dtype=np.uint8)
    output2 = np.zeros(shape=(height, width, 3), dtype=np.uint8)
    # pick random colors for each component
    colors = np.zeros(shape=(height * width, 3))
    for i in range(height * width):
        colors[i, :] = random_rgb()

    comps = {}
    index = 0
    for y in range(height):
        for x in range(width):
            comp = u.find(y * width + x)
            output[y, x, :] = colors[comp, :]

            if comp not in comps:
                comps[comp] = index
                index += 1
            output2[y, x, :] = comps[comp]
    print(index)
    elapsed_time = time.time() - start_time
    print(
        "Execution time: " + str(int(elapsed_time / 60)) + " minute(s) and " + str(
            int(elapsed_time % 60)) + " seconds")
    print(output.dtype, output.max())


    # displaying the result
    fig = plt.figure()
    a = fig.add_subplot(2, 2, 1)
    plt.imshow(in_image)
    a.set_title('Original Image')
    a = fig.add_subplot(2, 2, 2)
    plt.imshow(output)
    a.set_title('Segmented Image')

    a = fig.add_subplot(2, 2, 3)
    plt.imshow(output2)
    a.set_title('Segmented Image index')
    plt.show()

    return output, output2, index

if __name__ == "__main__":
    sigma = 0.2
    k = 100
    min = 50
    input_path = "data/aecc.png"

    # Loading the image
    input_image = imageio.imread(input_path)
    print(input_image[:10, :10, 1])
    print("Loading is done.")
    print("processing...")
    output, output2, index = segment(input_image, sigma, k, min)

    cv2.imwrite(input_path[:-4] + 'seg.png', output)
    cv2.imwrite(input_path[:-4] + f'seg{index}.png', output2)
2. 按灰度区域合并
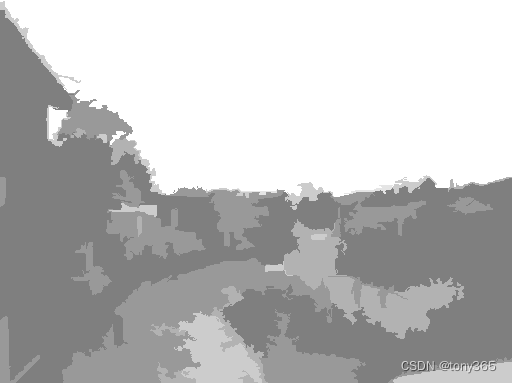
区域分割后129个region, 然后将其归类为10个gray zone.
灰度值范围[0, 1]
zone 0: [0,0.1]
zone 1: [0.1,0.2]
zone 2: [0.2,0.3]
zone 3: [0.3,0.4]
zone 4: [0.4,0.5]
zone 5: [0.5,0.6]
zone 6: [0.6,0.7]
zone 7: [0.7,0.8]
zone 8: [0.8,0.9]
zone 9: [0.9,1]
归为10类后,10个灰块,每个灰块用其zone范围的平均值表示,得到下图
或者每个region属于第i个gray zone,就标记为i
这样图像的值是0-9,接近黑色的。

计算 gamma 后的 细节:首先进行gamma操作,然后canny边缘检测,然后统计边的数量,来表示细节的多少。
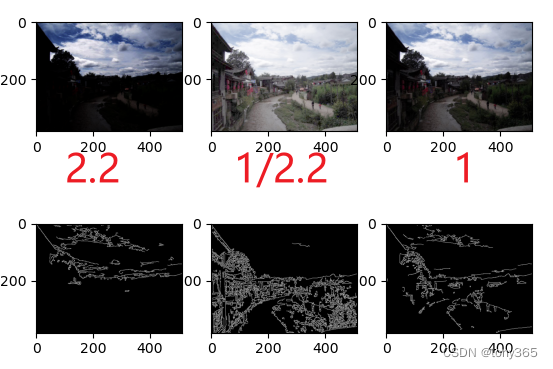
代码如下:
import cv2
import matplotlib.pyplot as plt
import numpy as np

if __name__ == "__main__":
    file1 = r'D:\code\aec-awb\pegbis-master\data\aecc.png'
    index = 129
    file2 = r'D:\code\aec-awb\pegbis-master\data\aeccseg129.png'
    im1 = cv2.imread(file1)
    im2 = cv2.imread(file2, 0)

    im1_gray = cv2.cvtColor(im1, cv2.COLOR_BGR2GRAY) / 255

    im_out = np.zeros_like(im1_gray, dtype=np.float32)
    im_out2 = np.zeros_like(im1_gray, dtype=np.uint8)
    for i in range(index):
        z = im1_gray[im2 == i]
        m = np.mean(z)

        d = np.floor(m / 0.1).astype(np.uint8)

        im_out[im2 == i] = d / 10 + 0.5
        im_out2[im2 == i] = d
    im_out = np.clip(im_out * 255, 0, 255).astype(np.uint8)

    cv2.imwrite(file1[:-4] + 'zone.png', im_out)
    cv2.imwrite(file1[:-4] + 'zone_index.png', im_out2)

    im_gamma1 = (im1 / 255) ** 2.2
    im_gamma2 = (im1 / 255) ** (1 / 2.2)
    im_gamma1 = np.clip(im_gamma1 * 255, 0, 255).astype(np.uint8)
    im_gamma2 = np.clip(im_gamma2 * 255, 0, 255).astype(np.uint8)
    im_canny1 = cv2.Canny(im_gamma1, 60, 210)
    im_canny2 = cv2.Canny(im_gamma2, 60, 210)
    im_canny = cv2.Canny(im1, 60, 210)

    im_canny_all = im_canny1 + im_canny2 + im_canny
    print(im_canny1.shape, im_canny.dtype, im_canny2.max(), im_canny1[:20, :20])

    plt.figure()
    plt.subplot(231)
    plt.imshow(im_gamma1[..., ::-1])

    plt.subplot(232)
    plt.imshow(im_gamma2[..., ::-1])

    plt.subplot(233)
    plt.imshow(im1[..., ::-1])

    plt.subplot(234)
    plt.imshow(im_canny1, 'gray')
    plt.subplot(235)
    plt.imshow(im_canny2, 'gray')
    plt.subplot(236)
    plt.imshow(im_canny, 'gray')

    plt.show()

    im_canny2[im_canny1 > 0] = 0
    im_canny1[im_canny2 > 0] = 0
    im_canny2[im_out2 >= 5] = 0
    im_canny1[im_out2 < 5] = 0
    print(im_canny1.dtype, im_canny1.shape)

    plt.figure()
    plt.subplot(221)
    plt.imshow(im_canny2, 'gray')
    plt.subplot(222)
    plt.imshow(im_canny1, 'gray')
    plt.subplot(223)
    plt.imshow(im_canny_all, 'gray')
    plt.show()

    v_s = np.count_nonzero(im_canny2)
    v_h = np.count_nonzero(im_canny1)
    v_all = np.count_nonzero(im_canny_all)
    print(v_s, v_h, v_all)


    vv = []
    cc = []

    for i in range(10):
        if i < 5:
            vv.append(np.count_nonzero(im_canny2[im_out2 == i]) / v_all)
        else:
            vv.append(np.count_nonzero(im_canny1[im_out2 == i]) / v_all)
        cc.append(np.count_nonzero(im_out2 == i) / (im_out2.shape[0] * im_out2.shape[1]))
    print(vv, cc)
3. 根据细节多少和各zone相对对比度约束,求解每个zone对应的 最优zone.
这部分感觉没有描述特别清楚。
4. 每个zone以及对应的最有zone找到之后,可以求解多项式curve的 ϕ s \phi_s ϕs 和 ϕ h \phi_h ϕh
这部分也暂略。
5. 关于curve
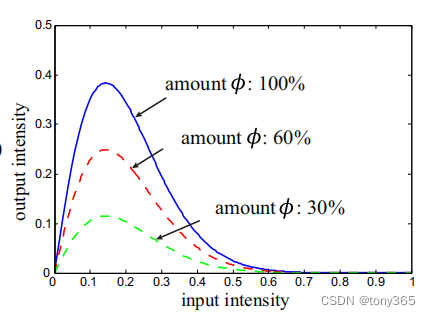
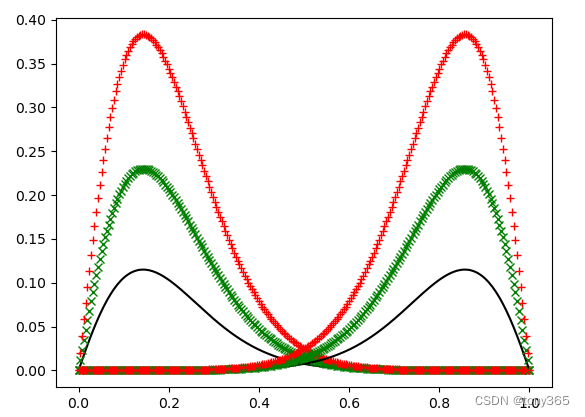
5.1 f Δ ( x ) f_{\Delta}(x) fΔ(x) 和 f Δ ( 1 − x ) f_{\Delta}(1-x) fΔ(1−x)
论文中图像如下:
复现图像如下 f Δ ( x ) f_{\Delta}(x) fΔ(x) 和 f Δ ( 1 − x ) f_{\Delta}(1-x) fΔ(1−x)
5.2 f ( x ) f(x) f(x)
公式

复现的曲线图
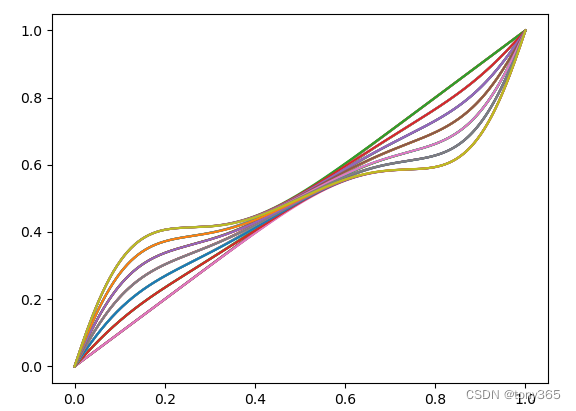
复现代码,并返回多个lut曲线。
def generate_lut():
    k1 = 5
    k2 = 14
    k3 = 1.6

    # x = np.arange(0, 1.0001, 1/255)
    x = np.arange(0, 256, 1) / 255
    f_delta = k1 * x * np.exp(-k2 * x ** k3)

    f_delta_m = k1 * (1 - x) * np.exp(-k2 * (1 - x) ** k3)

    plt.figure()
    plt.plot(x, 0.3 * f_delta, 'k-')
    plt.plot(x, 0.6 * f_delta, 'gx')
    plt.plot(x, f_delta, 'r+')

    plt.plot(x, 0.3 * f_delta_m, 'k-')
    plt.plot(x, 0.6 * f_delta_m, 'gx')
    plt.plot(x, f_delta_m, 'r+')
    plt.show()

    phi_s = np.round(np.arange(0, 0.7, 0.1), 1)
    phi_h = np.round(np.arange(0, 0.7, 0.1), 1)

    print('x : ', np.round(x * 255), len(x))
    lut = []
    plt.figure()
    for s in phi_s:
        for h in phi_h:
            f_x = x + s * f_delta - h * f_delta_m
            plt.plot(x, f_x)
            # print(s, h, np.round(f_x * 255, 1))
            lut.append(np.round(f_x * 255, 0))

    plt.show()
    return lut
5.3 通过多组lut曲线apply到图像,然后计算图像的细节量,根据图像细节量和人的感观选择合适的lut
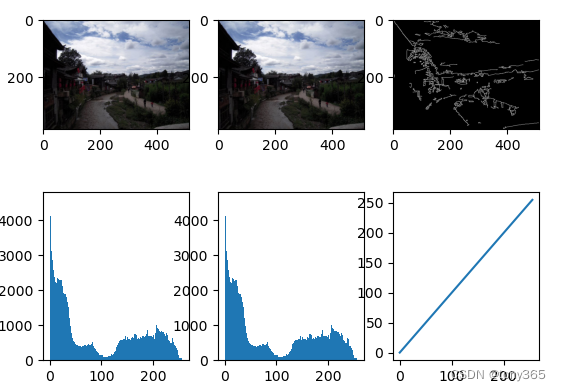
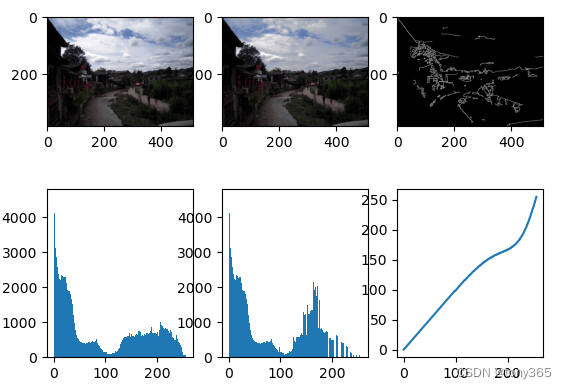
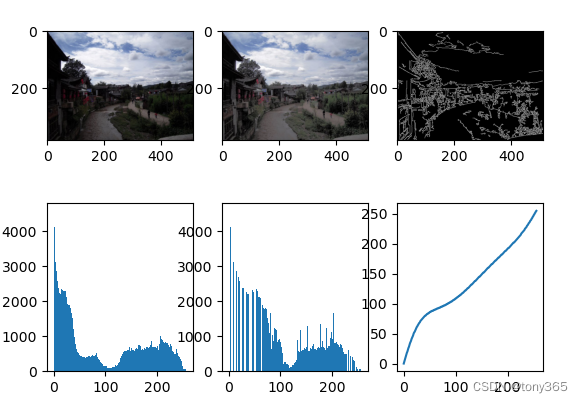
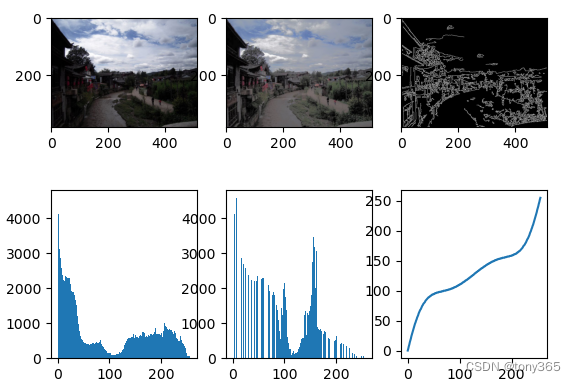
比如 一下不同的 lut查找表得到的
原图,查找后的图,查找后的边缘检测
原图Y直方图, 查找后的图的Y直方图, lut形状
下面举例几个不同的lut得到图像效果和对应的边缘
lut 1:
lut 2:
lut 3:
lut 4:
会打印出每种lut apply图像后得到的边缘检测细节数量,比如一共49各lut
0 7850
1 7428
2 7124
3 6623
4 6540
5 6733
6 6648
7 9567
8 9041
9 8718
10 8252
11 8117
12 8382
13 8205
14 11584
15 11057
16 10775
17 10285
18 10161
19 10503
20 10358
21 15409
22 14748
23 14554
24 14008
25 13883
26 14122
27 14040
28 18099
29 17580
30 17237
31 16885
32 16777
33 17000
34 16953
35 19699
36 19176
37 18825
38 18540
39 18419
40 18617
41 18540
42 21226
43 20720
44 20310
45 20029
46 19906
47 20151
48 20024
这里细节最高的 42各lut ,对应细节数量为21226, 但是实际效果不一定最好。
因此只是参考把。
import cv2
import numpy as np
from matplotlib import pyplot as plt


def generate_lut():
    k1 = 5
    k2 = 14
    k3 = 1.6

    # x = np.arange(0, 1.0001, 1/255)
    x = np.arange(0, 256, 1) / 255
    f_delta = k1 * x * np.exp(-k2 * x ** k3)

    f_delta_m = k1 * (1 - x) * np.exp(-k2 * (1 - x) ** k3)

    plt.figure()
    plt.plot(x, 0.3 * f_delta, 'k-')
    plt.plot(x, 0.6 * f_delta, 'gx')
    plt.plot(x, f_delta, 'r+')

    plt.plot(x, 0.3 * f_delta_m, 'k-')
    plt.plot(x, 0.6 * f_delta_m, 'gx')
    plt.plot(x, f_delta_m, 'r+')
    plt.show()

    phi_s = np.round(np.arange(0, 0.7, 0.1), 1)
    phi_h = np.round(np.arange(0, 0.7, 0.1), 1)

    print('x : ', np.round(x * 255), len(x))
    lut = []
    plt.figure()
    for s in phi_s:
        for h in phi_h:
            f_x = x + s * f_delta - h * f_delta_m
            plt.plot(x, f_x)
            # print(s, h, np.round(f_x * 255, 1))
            lut.append(np.round(f_x * 255, 0))

    plt.show()
    return lut

def apply_curve(y, lut):
    y1 = y.copy()
    h, w = y1.shape
    for i in range(h):
        for j in range(w):
            y1[i,j] = lut[y1[i,j]]
    return y1.astype(np.uint8)

def get_canny(im1, lut):
    yuv = cv2.cvtColor(im1, cv2.COLOR_BGR2YUV)
    y1 = apply_curve(yuv[..., 0], lut)
    yuv2 = cv2.merge([y1, yuv[..., 1], yuv[..., 2]])

    bgr = cv2.cvtColor(yuv2, cv2.COLOR_YUV2BGR)
    plt.subplot(231)
    plt.imshow(im1[..., ::-1])
    plt.subplot(232)
    plt.imshow(bgr[..., ::-1])

    plt.subplot(233)
    low_thr = 60
    high_thr = 210
    im1_canny = cv2.Canny(bgr, low_thr, high_thr)
    plt.imshow(im1_canny, 'gray')

    plt.subplot(234)
    plt.hist(yuv[..., 0].ravel(), 256, [0, 256])

    plt.subplot(235)
    plt.hist(y1.ravel(), 256, [0, 256])

    plt.subplot(236)

    x = np.arange(0, 256, 1)
    fx = lut[x]
    plt.plot(x, fx)
    plt.show()


    v = np.count_nonzero(im1_canny)
    return v, bgr, yuv, yuv2
if __name__ == "__main__":

    luts = generate_lut()

    file1 = r'D:\code\aec-awb\pegbis-master\data\aecc.png'
    im1 = cv2.imread(file1)


    index = 0
    v_max = 0
    plt.figure()
    for lut in luts:
        v, bgr, yuv, yuv2 = get_canny(im1, lut)

        if v > v_max:
            v_max = v
            index_max = index

        print(index, v)
        index += 1

    v, bgr, yuv, yuv2 = get_canny(im1, luts[index_max])
    print(v)
6. detail_preserve 方法
直接应用lut曲线感觉效果比较朦胧,因此论文中对此改进。

通透性效果会好很多

具体实现代码
import glob

import cv2
import numpy as np
from matplotlib import pyplot as plt

from curve import get_canny, generate_lut

def curve_s(bgr, d):
    im23 = bgr + [2 * bgr * (1 - bgr)] * (d / 255)
    im23 = np.squeeze(im23)
    im23 = np.clip(im23 * 255, 0, 255).astype(np.uint8)
    return im23
if __name__ == "__main__":
    file1 = r'D:\code\aec-awb\pegbis-master\data\40.jpg'
    im1 = cv2.imread(file1)[...,::-1]

    yuv = cv2.cvtColor(im1, cv2.COLOR_BGR2YUV)
    print(yuv.shape, yuv.dtype)

    im1_filter1 = cv2.bilateralFilter(im1, 27, 100, 100)
    im1_filter2 = cv2.bilateralFilter(im1, 27, 200, 200)
    im1_filter3 = cv2.bilateralFilter(im1, 27, 400, 400)

    d1 = im1.astype(np.int16) - im1_filter1
    d2 = im1.astype(np.int16) - im1_filter2
    d3 = im1.astype(np.int16) - im1_filter3

    plt.figure()
    plt.subplot(241)
    plt.imshow(im1_filter1)
    plt.subplot(242)
    plt.imshow(im1_filter2)
    plt.subplot(243)
    plt.imshow(im1_filter3)
    plt.subplot(244)
    plt.imshow(im1)

    plt.subplot(245)
    plt.imshow(np.abs(d1).astype(np.uint8))
    plt.subplot(246)
    plt.imshow(np.abs(d2).astype(np.uint8))
    plt.subplot(247)
    plt.imshow(np.abs(d3).astype(np.uint8))
    plt.show()


    indexs = [15, 20]
    luts = generate_lut()


    v, bgr, yuv, yuv2 = get_canny(im1[..., ::-1], luts[15])
    v2, bgr2, yuva, yuvb = get_canny(im1[..., ::-1], luts[42])
    cv2.imwrite(file1[:-4]+'_bgr.png', bgr)
    cv2.imwrite(file1[:-4] + '_bgr3.png', bgr2)


    bgr = bgr / 255
    bgr2 = bgr2 / 255

    im23 = curve_s(bgr, d3)
    im22 = curve_s(bgr, d2)
    im21 = curve_s(bgr, d1)

    im33 = curve_s(bgr2, d3)
    im32 = curve_s(bgr2, d2)
    im31 = curve_s(bgr2, d1)


    plt.figure()
    plt.subplot(251)
    plt.imshow(im1)
    plt.subplot(252)
    plt.imshow(bgr[...,::-1])
    plt.subplot(253)
    plt.imshow(im21[...,::-1])
    plt.subplot(254)
    plt.imshow(im22[..., ::-1])
    plt.subplot(255)
    plt.imshow(im23[..., ::-1])

    plt.subplot(257)
    plt.imshow(bgr2[..., ::-1])
    plt.subplot(258)
    plt.imshow(im31[..., ::-1])
    plt.subplot(259)
    plt.imshow(im32[..., ::-1])
    plt.subplot(2,5,10)
    plt.imshow(im33[..., ::-1])
    plt.show()

    cv2.imwrite(file1[:-4] + '_21.png', im21)
    cv2.imwrite(file1[:-4] + '_22.png', im22)
    cv2.imwrite(file1[:-4] + '_23.png', im23)
    cv2.imwrite(file1[:-4] + '_41.png', im31)
    cv2.imwrite(file1[:-4] + '_42.png', im32)
    cv2.imwrite(file1[:-4] + '_43.png', im33)

    files = glob.glob(r'D:\code\aec-awb\pegbis-master\testdata\*')
    for file in files:
        if not file.endswith('b.png'):
            print(file)
            im1 = cv2.imread(file)[..., ::-1]
            # yuv = cv2.cvtColor(im1, cv2.COLOR_BGR2YUV)

            v, bgr, yuv, yuv2 = get_canny(im1[..., ::-1], luts[15])
            v2, bgr2, yuva, yuvb = get_canny(im1[..., ::-1], luts[42])
            cv2.imwrite(file[:-4] + '_bgr.png', bgr)
            cv2.imwrite(file[:-4] + '_bgr3.png', bgr2)

            bgr = bgr / 255
            bgr2 = bgr2 / 255

            im1_filter1 = cv2.bilateralFilter(im1, 27, 100, 100)
            im1_filter2 = cv2.bilateralFilter(im1, 27, 200, 200)
            im1_filter3 = cv2.bilateralFilter(im1, 27, 400, 400)

            d1 = im1.astype(np.int16) - im1_filter1
            d2 = im1.astype(np.int16) - im1_filter2
            d3 = im1.astype(np.int16) - im1_filter3
            im23 = curve_s(bgr, d3)
            im22 = curve_s(bgr, d2)
            im21 = curve_s(bgr, d1)
            im33 = curve_s(bgr2, d3)
            im32 = curve_s(bgr2, d2)
            im31 = curve_s(bgr2, d1)
            cv2.imwrite(file[:-4] + '_21.png', im21)
            cv2.imwrite(file[:-4] + '_22.png', im22)
            cv2.imwrite(file[:-4] + '_23.png', im23)
            cv2.imwrite(file[:-4] + '_41.png', im31)
            cv2.imwrite(file[:-4] + '_42.png', im32)
            cv2.imwrite(file[:-4] + '_43.png', im33)
