Linux tracepoint 简介
文章目录
- 前言
- 一、跟踪点的目的
- 二、跟踪点的使用
- 2.1 简介
- 2.2 DECLARE_TRACE
- 三、TRACE_EVENT
- 参考资料
前言
本文提供了如何在内核中插入跟踪点并将 probe functions 连接到它们的示例,并提供了一些 probe functions 的示例。可以在不创建自定义内核模块的情况下使用跟踪点来使用事件跟踪基础结构注册探测函数。
一、跟踪点的目的
tracepoint是内核预先定义的静态探测点,是一种静态插桩方法,可以用于挂载钩子(hook)函数来做trace,放置在代码中的跟踪点提供了一个钩子(hook)来调用您可以在运行时提供的函数(探针)。跟踪点可以是“on”(一个 probe连接到跟踪点)或“off”(没有 probe 附加到跟踪点上)。当跟踪点“关闭”时,除了添加一个微小的时间惩罚(检查分支的条件)和空间惩罚(在插入指令的函数末尾为函数调用添加几个字节,并在单独的部分中添加一个数据结构)之外,它没有任何其它影响。当跟踪点为“on”时,每次在调用方的执行上下文中执行跟踪点时都会调用您提供的函数。当提供的函数结束其执行时,它返回到调用者(从 tracepoint site 继续)。
可以在代码中的重要位置放置跟踪点。它们是轻量级钩子,可以传递任意数量的参数,原型在放置在头文件中的跟踪点声明中描述。
当系统执行到 tracepoint 点时,会执行 tracepoint 上的我们注册的 probe 函数(可以注册多个 probe 函数),类似于printk,输出当前 tracepoint 上下文的环境信息,只是不是输出到终端,而是 ring buffer,这样我们在用户层通过debugfs(tracefs)接口就可以读取 ring buffer 中的信息,了解到内核中当前运行的状态。
tracepoints可以用于跟踪和性能计数。跟踪点表示内核中使用的一些重要事件,构建系统内正在发生的事情的“全貌”。跟踪点是内核源代码中的一个标记,当启用它时,可以用来在标记所在的点处挂钩到正在运行的内核。它们可由许多工具用于内核调试和性能问题诊断。
二、跟踪点的使用
2.1 简介
跟踪点需要两个元素:
头文件中存放跟踪点语句(为了使用跟踪点,应该包括linux/tracepoint.h。)。
In include/trace/events/subsys.h:
#undef TRACE_SYSTEM
#define TRACE_SYSTEM subsys

#if !defined(_TRACE_SUBSYS_H) || defined(TRACE_HEADER_MULTI_READ)
#define _TRACE_SUBSYS_H

#include <linux/tracepoint.h>

DECLARE_TRACE(subsys_eventname,
        TP_PROTO(int firstarg, struct task_struct *p),
        TP_ARGS(firstarg, p));

#endif /* _TRACE_SUBSYS_H */

/* This part must be outside protection */
#include <trace/define_trace.h>
c文件中跟踪点的声明。
In subsys/file.c (其中必须添加跟踪语句):
#include <trace/events/subsys.h>

#define CREATE_TRACE_POINTS
DEFINE_TRACE(subsys_eventname);

void somefct(void)
{
        ...
        trace_subsys_eventname(arg, task);
        ...
}
(1)
subsys_eventname是事件的唯一标识符:
subsys是子系统的名称。
eventname是要跟踪的事件的名称。
会在 tracing/event/目录下产生: tracing/event/subsys/subsys_eventname/ 这样一个跟踪点目录。
(2)
TP_PROTO(int firstarg,struct task_struct*p)是此跟踪点调用的函数的原型。
TP_ARGS(firstarg,p)是与原型中相同的参数名称。
(3)
如果在多个源文件中使用 the header ,#define CREATE_TRACE_POINTS应该只出现在一个源文件中。
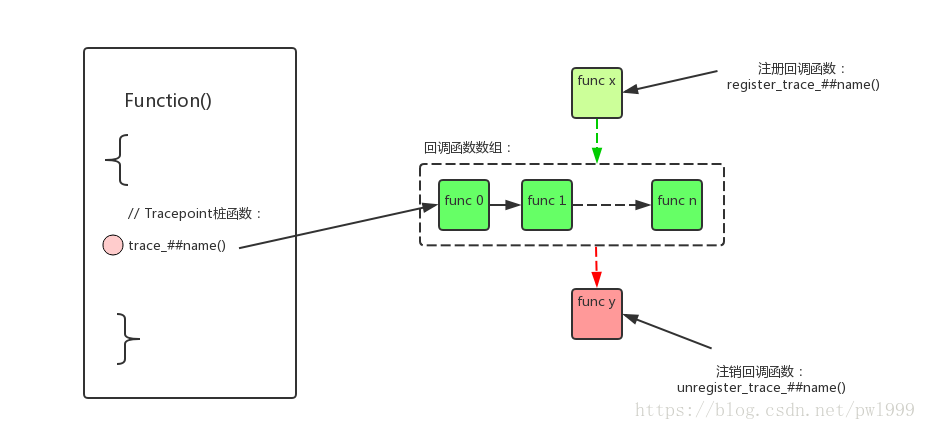
通过register_trace_subsys_eventname()为特定跟踪点提供 probe(要调用的函数),可以将函数(probe)连接到跟踪点。通过unregister_trace_subsys_eventname()删除probe;它将移除probe。必须在模块退出函数结束之前调用tracepoint_synchronize_unregister(),以确保没有使用 probe 的调用者。这一点,以及在探测调用周围禁用抢占的事实,确保探测移除和模块卸载是安全的。
跟踪点机制支持插入同一跟踪点的多个实例,但必须在所有内核上对给定的跟踪点名称进行单个定义,以确保不会发生类型冲突。使用原型对跟踪点进行名称修改,以确保类型正确。编译器在注册站点验证探针类型的正确性。跟踪点可以放在内联函数、内联静态函数、展开循环以及常规函数中。
这里建议使用命名方案“subsys_event”作为限制冲突的约定。跟踪点名称对内核是全局的:无论是在核心内核映像中还是在模块中,它们都被认为是相同的。
如果必须在内核模块中使用跟踪点,则可以使用EXPORT_TRACEPOINT_SYMBOL_GPL()或EXPORT_TRACEPOINT_SYMBOL()导出定义的跟踪点。
#define EXPORT_TRACEPOINT_SYMBOL_GPL(name)				\
	EXPORT_SYMBOL_GPL(__tracepoint_##name)
#define EXPORT_TRACEPOINT_SYMBOL(name)					\
	EXPORT_SYMBOL(__tracepoint_##name)
如果您需要为跟踪点参数做一些工作,并且该工作仅用于跟踪点,则可以使用以下语句将该工作封装在 If 语句中:
if (trace_foo_bar_enabled()) {
        int i;
        int tot = 0;

        for (i = 0; i < count; i++)
                tot += calculate_nuggets();

        trace_foo_bar(tot);
}
所有trace_tracepoint()调用都定义了一个匹配的trace_tracepoint_enabled()函数,如果启用了跟踪点,则返回true,否则返回false。trace_tracepoint()应该始终位于if(trace_trackpoint_enabled())的块内,以防止启用的跟踪点和看到的检查之间的竞争。
使用trace_tracepoint_enabled()的优点是它使用跟踪点的static_key来允许使用跳转标签实现if语句,并避免条件分支。
如果需要从头文件中调用跟踪点,建议不要直接调用跟踪点或使用trace_tracepoint_enabled()函数调用,因为如果头文件中包含的头文件设置了CREATE_TRACE_POINTS ,则头文件中的跟踪点可能会产生副作用,此外,trace_tracepoint()在内联函数中并没有那么小,如果被其他内联函数使用,可能会导致内核膨胀。取而代之的是,包括tracepoint-defs.h并使用tracepoint_Enable()。
In a C file:
void do_trace_foo_bar_wrapper(args)
{
        trace_foo_bar(args);
}
In the header file:
DECLARE_TRACEPOINT(foo_bar);

static inline void some_inline_function()
{
        [..]
        if (tracepoint_enabled(foo_bar))
                do_trace_foo_bar_wrapper(args);
        [..]
}
2.2 DECLARE_TRACE
(1)
DECLARE_TRACE()传递“proto”作为跟踪点原型,传递“void*__data,proto”为回调原型。
#define DECLARE_TRACE(name, proto, args)				\
		__DECLARE_TRACE(name, PARAMS(proto), PARAMS(args), 1,	\
				PARAMS(void *__data, proto),		\
				PARAMS(__data, args))
(2)
/*
 * Make sure the alignment of the structure in the __tracepoints section will
 * not add unwanted padding between the beginning of the section and the
 * structure. Force alignment to the same alignment as the section start.
 */
#define __DECLARE_TRACE(name, proto, args, cond, data_proto, data_args) \
	extern struct tracepoint __tracepoint_##name;			\
	static inline void trace_##name(proto)				\
	{								\
		if (static_key_false(&__tracepoint_##name.key))		\
			__DO_TRACE(&__tracepoint_##name,		\
				TP_PROTO(data_proto),			\
				TP_ARGS(data_args),			\
				TP_CONDITION(cond),,);			\
	}								\
	__DECLARE_TRACE_RCU(name, PARAMS(proto), PARAMS(args),		\
		PARAMS(cond), PARAMS(data_proto), PARAMS(data_args))	\

	//通过register_trace_##name()为跟踪点提供 probe
	static inline int						\
	register_trace_##name(void (*probe)(data_proto), void *data)	\
	{								\
		return tracepoint_probe_register(#name, (void *)probe,	\
						 data);			\
	}								\

	//通过unregister_trace_##name()删除probe,移除probe
	static inline int						\
	unregister_trace_##name(void (*probe)(data_proto), void *data)	\
	{								\
		return tracepoint_probe_unregister(#name, (void *)probe, \
						   data);		\
	}								\
	static inline void						\
	check_trace_callback_type_##name(void (*cb)(data_proto))	\
	{								\
	}
// linux-3.10/kernel/tracepoint.c

/**
 * tracepoint_probe_register -  Connect a probe to a tracepoint
 * @name: tracepoint name
 * @probe: probe handler
 *
 * Returns 0 if ok, error value on error.
 * The probe address must at least be aligned on the architecture pointer size.
 */
int tracepoint_probe_register(const char *name, void *probe, void *data)
{
	struct tracepoint_func *old;

	mutex_lock(&tracepoints_mutex);
	old = tracepoint_add_probe(name, probe, data);
	if (IS_ERR(old)) {
		mutex_unlock(&tracepoints_mutex);
		return PTR_ERR(old);
	}
	tracepoint_update_probes();		/* may update entry */
	mutex_unlock(&tracepoints_mutex);
	release_probes(old);
	return 0;
}
EXPORT_SYMBOL_GPL(tracepoint_probe_register);

/**
 * tracepoint_probe_unregister -  Disconnect a probe from a tracepoint
 * @name: tracepoint name
 * @probe: probe function pointer
 *
 * We do not need to call a synchronize_sched to make sure the probes have
 * finished running before doing a module unload, because the module unload
 * itself uses stop_machine(), which insures that every preempt disabled section
 * have finished.
 */
int tracepoint_probe_unregister(const char *name, void *probe, void *data)
{
	struct tracepoint_func *old;

	mutex_lock(&tracepoints_mutex);
	old = tracepoint_remove_probe(name, probe, data);
	if (IS_ERR(old)) {
		mutex_unlock(&tracepoints_mutex);
		return PTR_ERR(old);
	}
	tracepoint_update_probes();		/* may update entry */
	mutex_unlock(&tracepoints_mutex);
	release_probes(old);
	return 0;
}
EXPORT_SYMBOL_GPL(tracepoint_probe_unregister);
struct tracepoint_func {
	void *func;
	void *data;
};

struct tracepoint {
	const char *name;		/* Tracepoint name */
	struct static_key key;
	void (*regfunc)(void);
	void (*unregfunc)(void);
	struct tracepoint_func __rcu *funcs;
};
每种Tracepoint有一个name、一个key开关、一系列桩函数。
key(static_key来允许使用跳转标签实现if语句,并避免条件分支):tracepoint是否使能的开关trace_tracepoint_enabled(),如果回调函数数组为空则key为disable,如果回调函数数组中有函数指针则key为enable。
regfunc:注册回调函数时用到的hook函数(注意:不是用来注册回调函数的,注册回调函数是register_trace_##name)。
unregfunc:注销回调函数时的的hook函数(注意:不是用来注销回调函数的,注销回调函数是unregister_trace_##name)。
/*
 * Sets the probe callback corresponding to one tracepoint.
 */
static void set_tracepoint(struct tracepoint_entry **entry,
	struct tracepoint *elem, int active)
{
	WARN_ON(strcmp((*entry)->name, elem->name) != 0);

	if (elem->regfunc && !static_key_enabled(&elem->key) && active)
		elem->regfunc();
	else if (elem->unregfunc && static_key_enabled(&elem->key) && !active)
		elem->unregfunc();

	/*
	 * rcu_assign_pointer has a smp_wmb() which makes sure that the new
	 * probe callbacks array is consistent before setting a pointer to it.
	 * This array is referenced by __DO_TRACE from
	 * include/linux/tracepoints.h. A matching smp_read_barrier_depends()
	 * is used.
	 */
	rcu_assign_pointer(elem->funcs, (*entry)->funcs);
	if (active && !static_key_enabled(&elem->key))
		static_key_slow_inc(&elem->key);
	else if (!active && static_key_enabled(&elem->key))
		static_key_slow_dec(&elem->key);
}

/*
 * Disable a tracepoint and its probe callback.
 * Note: only waiting an RCU period after setting elem->call to the empty
 * function insures that the original callback is not used anymore. This insured
 * by preempt_disable around the call site.
 */
static void disable_tracepoint(struct tracepoint *elem)
{
	if (elem->unregfunc && static_key_enabled(&elem->key))
		elem->unregfunc();

	if (static_key_enabled(&elem->key))
		static_key_slow_dec(&elem->key);
	rcu_assign_pointer(elem->funcs, NULL);
}
funcs:回调函数数组,tracepoint的作用就是在桩函数被命中时,逐个调用回调函数数组中的函数。
(3)
#ifdef CONFIG_TRACEPOINTS

/*
 * it_func[0] is never NULL because there is at least one element in the array
 * when the array itself is non NULL.
 *
 * Note, the proto and args passed in includes "__data" as the first parameter.
 * The reason for this is to handle the "void" prototype. If a tracepoint
 * has a "void" prototype, then it is invalid to declare a function
 * as "(void *, void)". The DECLARE_TRACE_NOARGS() will pass in just
 * "void *data", where as the DECLARE_TRACE() will pass in "void *data, proto".
 */
#define __DO_TRACE(tp, proto, args, cond, prercu, postrcu)		\
	do {								\
		struct tracepoint_func *it_func_ptr;			\
		void *it_func;						\
		void *__data;						\
									\
		if (!(cond))						\
			return;						\
		prercu;							\
		rcu_read_lock_sched_notrace();				\
		it_func_ptr = rcu_dereference_sched((tp)->funcs);	\
		if (it_func_ptr) {					\
			do {						\
				it_func = (it_func_ptr)->func;		\
				__data = (it_func_ptr)->data;		\
				((void(*)(proto))(it_func))(args);	\
			} while ((++it_func_ptr)->func);		\
		}							\
		rcu_read_unlock_sched_notrace();			\
		postrcu;						\
	} while (0)
一个 while 循环 ,依次执行回调函数数组 struct tracepoint_func __rcu *funcs 的 回调函数 func ;即依次执行 tracepoint 上的注册的回调函数。
三、TRACE_EVENT
我在这三篇文章中描述了 TRACE_EVENT :
Linux 调试之 TRACE_EVENT(一)
Linux 调试之 TRACE_EVENT(二)
Linux 调试之 TRACE_EVENT(三)
(1)
注意这里 TRACE_EVENT 宏展开是 DECLARE_TRACE 宏:
// linux-3.10/include/linux/tracepoint.h

#define TRACE_EVENT(name, proto, args, struct, assign, print)	\
	DECLARE_TRACE(name, PARAMS(proto), PARAMS(args))
(2)
注意这里 TRACE_EVENT 宏展开是 DEFINE_TRACE 宏:
// linux-3.10/include/linux/tracepoint.h

/*
 * We have no guarantee that gcc and the linker won't up-align the tracepoint
 * structures, so we create an array of pointers that will be used for iteration
 * on the tracepoints.
 */
#define DEFINE_TRACE_FN(name, reg, unreg)				 \
	static const char __tpstrtab_##name[]				 \
	__attribute__((section("__tracepoints_strings"))) = #name;	 \
	struct tracepoint __tracepoint_##name				 \
	__attribute__((section("__tracepoints"))) =			 \
		{ __tpstrtab_##name, STATIC_KEY_INIT_FALSE, reg, unreg, NULL };\
	static struct tracepoint * const __tracepoint_ptr_##name __used	 \
	__attribute__((section("__tracepoints_ptrs"))) =		 \
		&__tracepoint_##name;

#define DEFINE_TRACE(name)						\
	DEFINE_TRACE_FN(name, NULL, NULL);

// linux-3.10/include/trace/define_trace.h

#undef TRACE_EVENT
#define TRACE_EVENT(name, proto, args, tstruct, assign, print)	\
	DEFINE_TRACE(name)
[root@localhost ]# readelf -S xfs.ko
There are 48 section headers, starting at offset 0x181bf0:

Section Headers:
  [Nr] Name              Type             Address           Offset
       Size              EntSize          Flags  Link  Info  Align
  ......
  [17] __tracepoints_ptr PROGBITS         0000000000000000  000f7f98
       0000000000000bc0  0000000000000000   A       0     0     8
  [18] .rela__tracepoint RELA             0000000000000000  000f8b58
       0000000000002340  0000000000000018   I      44    17     8
  [19] __tracepoints_str PROGBITS         0000000000000000  000faea0
  ......
  [37] __tracepoints     PROGBITS         0000000000000000  00137520
       0000000000005df8  0000000000000000  WA       0     0     32
  [38] .rela__tracepoint RELA             0000000000000000  0013d318
       0000000000002340  0000000000000018   I      44    37     8
  ......
Key to Flags:
  W (write), A (alloc), X (execute), M (merge), S (strings), I (info),
  L (link order), O (extra OS processing required), G (group), T (TLS),
  C (compressed), x (unknown), o (OS specific), E (exclude),
  l (large), p (processor specific)
DECLARE_TRACE 宏 和 DEFINE_TRACE 宏 不一样。
从 TRACE_EVENT 的宏定义可以看到,TRACE_EVENT使用的是 tracepoint 机制。需要静态的定义桩函数,并且在插桩位置显式的调用。
宏TRACE_EVENT提供了定义跟踪点的另一种方法。trace event可以使用 tracepoint 机制,内核其它机制也可以使用 tracepoint ,只是kernel的绝大部分tracepoint都是trace event在使用,trace event也必须向tracepoint注册自己的回调函数,这些回调函数的作用就是在函数被命中时往ring buffer中写入trace信息。内核提前帮我们实现了钩子(hook)函数并挂到tracepoint上,当使能一个 trace event 时,它会输出内容到ftrace ringbuffer中,这样就可以获取到内核运行信息了。
参考资料
Linux 3.10.0
https://static.lwn.net/kerneldoc/trace/tracepoints.html
https://pwl999.blog.csdn.net/article/details/80514271
https://blog.csdn.net/jasonactions/article/details/123470620
https://blog.csdn.net/Rong_Toa/article/details/116602224
https://zhuanlan.zhihu.com/p/547477490