Qt图表操作(QCustomPlot 与 QtCharts的介绍与使用)
一、QCustomPlot简介
QCustomPlot是QT下一个方便易用的绘图工具,该绘图库专注于制作美观,出版品质的2D图表,图表和图表,以及为实时可视化应用程序提供高性能。它可以导出为各种格式,如矢量化的PDF文件和光栅化图像,如PNG,JPG和BMP。
官网:https://www.qcustomplot.com
下载:
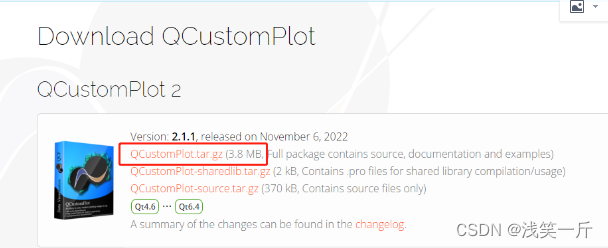
压缩包中有QCustomPlot的官方使用示例:plot-examples和核心文件: qcuamplesstomplot.h、qcustomplot.cpp,使用方法是通过添加现有文件将 qcustomplot.h、qcustomplot.cpp加入工程,并在pro文件中加入printsupport,放置widget并提升为QCustomPlot。
外网网速不好,也可以通过csdn下载:https://download.csdn.net/download/linyibin_123/87388205
二、QtCharts简介
Qt Charts是Qt自带的组件库,其中包含折线、曲线、饼图、棒图、散点图、雷达图等各种常用的图表。它的核心是 QChartView(显示图表)和QChart(管理数据),QChartView是一个能够显示图表的widget,是用来显示数据,而QChart类用来管理图表的数据序列(series)、图例(legends)和坐标轴(axes)。
三、QCustomPlot 与 QCharts的对比
1.性能:
1)QCustomPlot是一个比较完善的框架,其框架和缓存化的处理使其处理性能大幅度提升,支持十万以上的数据量。
2)QtCharts只是一个半成品,不论是否有bug,QtCharts在两千个点以内是可以使用的,超过两千个点就存在刷新卡顿的问题。
2.功能:
QChart可绘制的图标种类比QCustomPlot多。
3.使用:
QChar无需配置,是Qt自带的,QCustomPlot需要配置两个源文件:qcustomplot.h和qcustomplot.cpp。
四、QCustomPlot的使用
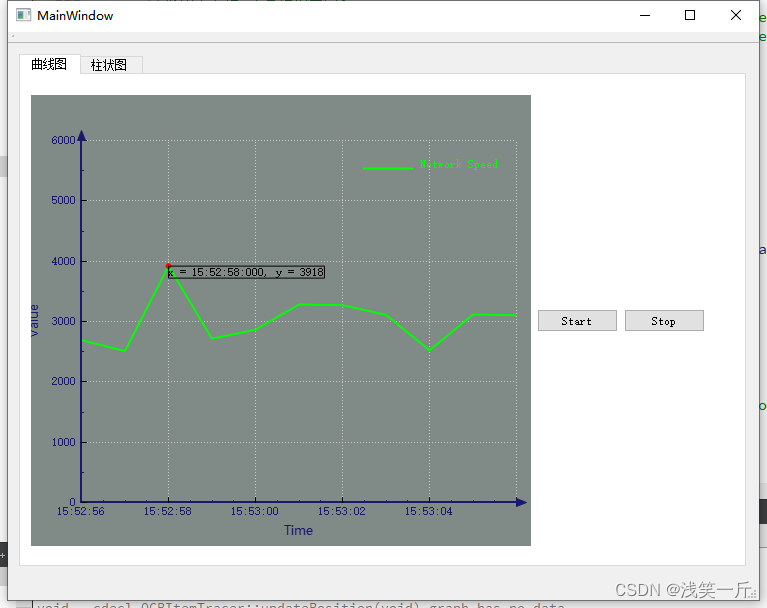
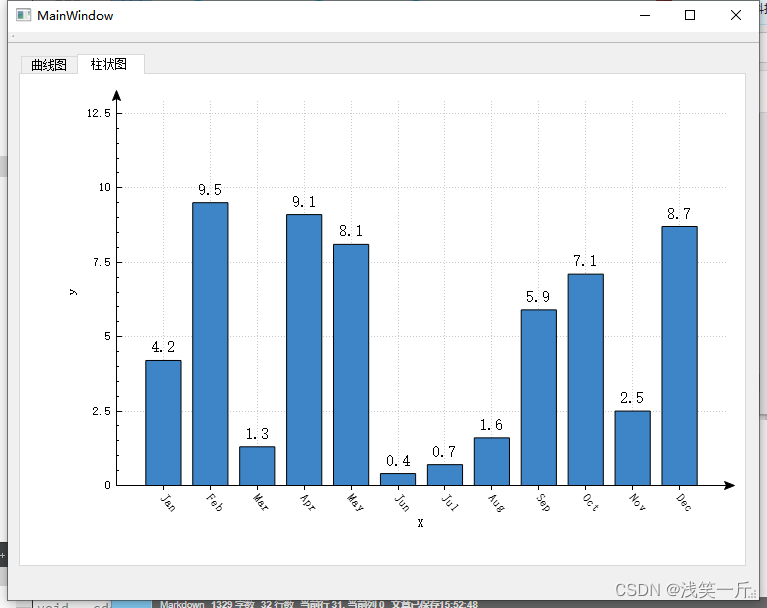
官网的示例绘制的图表都相对复杂,以下demo封装一些常用的图表:柱状图、实时曲线图、饼状图。
1.界面效果
2.核心代码
ctcumtomplot.h
#ifndef CTCUMTOMPLOT_H
#define CTCUMTOMPLOT_H

#include <QObject>
#include <QMouseEvent>
#include "qcustomplot.h"
#include <QTimer>
#include "commondef.h"
#include "custombars.h"

class CtCumtomPlot : public QObject
{
    Q_OBJECT
public:
    explicit CtCumtomPlot();
    ~CtCumtomPlot();

    static CtCumtomPlot& getInstance();

    //曲线
    void CreateRealCurve(QCustomPlot *pCustomPlot);
    void setCurve(GRAPH_CURVE_T graphPara);

    //柱状图
    void CreateHistogram(QCustomPlot *pCustomPlot, GRAPH_HISTOGRAM_T graphPara);

public slots:
    void mouseMove(QMouseEvent *e);

private:
    //曲线
    QCustomPlot* m_pCurveCP;
    QCPItemTracer* m_pCurveT;
    QCPItemText* m_pCurveTL;

    //柱状图
    QCustomPlot* m_pHistogramCP;
};

#endif // CTCUMTOMPLOT_H
ctcumtomplot.cpp
#include "ctcumtomplot.h"
#include <QTime>

CtCumtomPlot::CtCumtomPlot()
{
}

CtCumtomPlot::~CtCumtomPlot()
{
    if(m_pCurveT)
        delete m_pCurveT;

    if(m_pCurveTL)
        delete m_pCurveTL;

    if(m_pCurveCP)
        delete m_pCurveCP;
}

CtCumtomPlot &CtCumtomPlot::getInstance()
{
    static CtCumtomPlot s_obj;
    return s_obj;
}

/**********************
*实时曲线
***********************/
void CtCumtomPlot::CreateRealCurve(QCustomPlot *pCustomPlot)
{
    m_pCurveCP = pCustomPlot;

    //设置布局
    pCustomPlot->plotLayout()->insertRow(0);
    pCustomPlot->plotLayout()->insertColumn(0);
    pCustomPlot->axisRect()->setAutoMargins(QCP::msBottom | QCP::msRight);
    pCustomPlot->plotLayout()->setRowStretchFactor(0, 0.1);
    pCustomPlot->plotLayout()->setColumnStretchFactor(0, 0.1);

    //设置图形标注
    pCustomPlot->legend->setVisible(true);
    pCustomPlot->legend->setFont(QFont("Helvetica", 9));
    pCustomPlot->legend->setTextColor(0x00ff00);
    pCustomPlot->legend->setFillOrder(QCPLayoutGrid::foColumnsFirst); //横向画图
    pCustomPlot->legend->setBorderPen(Qt::NoPen);//设置边框
    pCustomPlot->legend->setIconSize(50, 20);
    pCustomPlot->legend->setBrush(QBrush(Qt::transparent));//设置背景透明

    //设置背景
    pCustomPlot->setBackground(QBrush(QColor(128, 138, 135)));


    //设置坐标轴颜色\画笔\末端样式
    pCustomPlot->xAxis->setBasePen(QPen(QColor("#191970"), 2));     // 轴线画笔
    pCustomPlot->xAxis->setSubTickPen(QPen(QColor("#191970"), 1));  // 轴刻度的画笔
    pCustomPlot->xAxis->setSubTickPen(QPen(QColor("#191970"), 1));  // 轴子刻度线的画笔
    pCustomPlot->xAxis->setTickLabelColor(QColor("#191970"));       // 坐标轴上字体

    pCustomPlot->yAxis->setBasePen(QPen(QColor("#191970"), 2));     // 轴线画笔
    pCustomPlot->yAxis->setSubTickPen(QPen(QColor("#191970"), 1));  // 轴刻度的画笔
    pCustomPlot->yAxis->setSubTickPen(QPen(QColor("#191970"), 1));  // 轴子刻度线的画笔
    pCustomPlot->yAxis->setTickLabelColor(QColor("#191970"));       // 坐标轴上字体

    pCustomPlot->xAxis->setUpperEnding(QCPLineEnding::esFlatArrow);
    pCustomPlot->yAxis->setUpperEnding(QCPLineEnding::esFlatArrow);

    //添加一条曲线
    m_pCurveCP->addGraph();
    //设置右上角图形标注名称
    m_pCurveCP->graph(0)->setName(QString::fromLocal8Bit("Network Speed"));
    //设置画笔颜色
    m_pCurveCP->graph(0)->setPen(QPen(Qt::green, 2));

    //设置坐标轴时间显示
    QSharedPointer<QCPAxisTickerTime> timeTick(new QCPAxisTickerTime);
    timeTick->setTimeFormat("%h:%m:%s");
    m_pCurveCP->xAxis->setTicker(timeTick);

    //设置坐标轴描述
    m_pCurveCP->xAxis->setLabelFont(QFont("Microsoft YaHei", 10));
    m_pCurveCP->yAxis->setLabelFont(QFont("Microsoft YaHei", 10));
    m_pCurveCP->xAxis->setLabelColor(QColor("#191970"));
    m_pCurveCP->yAxis->setLabelColor(QColor("#191970"));
    m_pCurveCP->xAxis->setLabel("Time");
    m_pCurveCP->yAxis->setLabel("Value");

    //显示子刻度
    m_pCurveCP->xAxis->setSubTicks(true);
    m_pCurveCP->yAxis->setSubTicks(true);

    //设置基本坐标轴(左侧Y轴和下方X轴)可拖动、可缩放、曲线可选、legend可选、设置伸缩比例,使所有图例可见
    m_pCurveCP->setInteractions(QCP::iRangeDrag | QCP::iRangeZoom | QCP::iSelectAxes |
                                   QCP::iSelectLegend | QCP::iSelectPlottables);

    //设置游标
    m_pCurveT = new QCPItemTracer(m_pCurveCP);
    m_pCurveT->setPen(QPen(Qt::red));//圆圈轮廓颜色
    m_pCurveT->setBrush(QBrush(Qt::red));//圆圈圈内颜色
    m_pCurveT->setStyle(QCPItemTracer::tsCircle);//圆圈
    m_pCurveT->setSize(5);//设置大小

    //游标说明
    m_pCurveTL = new QCPItemText(m_pCurveCP);
    m_pCurveTL->setLayer("overlay");//设置图层为overlay(频繁刷新需要)
    m_pCurveTL->setPen(QPen(Qt::black));//设置游标说明颜色
    m_pCurveTL->setPositionAlignment(Qt::AlignLeft | Qt::AlignTop);//左上
    m_pCurveTL->position->setParentAnchor(m_pCurveT->position);//将游标说明固定在游标上,实现自动跟随

    connect(m_pCurveCP, SIGNAL(mouseMove(QMouseEvent*)), this, SLOT(mouseMove(QMouseEvent*)));

    //使用上下轴 左右轴范围同步
    //connect(m_pCurveCP->xAxis, SIGNAL(rangeChanged(QCPRange)), m_pCurveCP->xAxis2, SLOT(setRange(QCPRange)));
    //connect(m_pCurveCP->yAxis, SIGNAL(rangeChanged(QCPRange)), m_pCurveCP->yAxis2, SLOT(setRange(QCPRange)));
}

void CtCumtomPlot::setCurve(GRAPH_CURVE_T graphPara)
{
    if(m_pCurveCP)
    {
        //设置数据
        m_pCurveCP->graph(0)->addData(graphPara.X, graphPara.Y);

        //删除10秒之前的数据
        m_pCurveCP->graph(0)->removeDataBefore(static_cast<int>(graphPara.X - 10));
        m_pCurveCP->yAxis->setRange(0, 6000);

        //设置Y轴有7个坐标
        m_pCurveCP->yAxis->ticker()->setTickCount(7);
        m_pCurveCP->graph(0)->rescaleKeyAxis();

        //设置横坐标范围
        m_pCurveCP->xAxis->setRange(graphPara.X, 10, Qt::AlignRight);//void QCPAxis::setRange (double position, double size, Qt::AlignmentFlag alignment )

        //重绘
        m_pCurveCP->replot();
    }
}

void CtCumtomPlot::mouseMove(QMouseEvent *e)
{
    //鼠标坐标转化为CustomPlot内部坐标
    double x = m_pCurveCP->xAxis->pixelToCoord(e->pos().x());

    //将游标和该曲线图层连接
    m_pCurveT->setGraph(m_pCurveCP->graph(0));

    //将游标横坐标设置成刚获得的横坐标数据x
    m_pCurveT->setGraphKey(x);

    //游标的纵坐标可以通过曲线数据线性插值自动获得
    m_pCurveT->setInterpolating(true);

    //使得刚设置游标的横纵坐标位置生效
    m_pCurveT->updatePosition();

    //更新游标说明的内容
    double xValue = m_pCurveT->position->key();
    double yValue = m_pCurveT->position->value();

    //x坐标转时间,游标显示
    QTime time1(0, 0, 0, 0);
    QTime newTime = time1.addMSecs(static_cast<int>(xValue*1000));
    m_pCurveTL->setText(QString("x = %1, y = %2").arg(newTime.toString(QString::fromLatin1("hh:mm:ss:zzz"))).arg(yValue));

    //重绘
    m_pCurveCP->replot();
}

/**********************
*柱状图
***********************/
void CtCumtomPlot::CreateHistogram(QCustomPlot *pCustomPlot, GRAPH_HISTOGRAM_T graphPara)
{
    m_pHistogramCP = pCustomPlot;

    //使用xAxis、yAxis作为柱状图的x轴、y轴
    QCPAxis *xAxis = m_pHistogramCP->xAxis;
    QCPAxis *yAxis = m_pHistogramCP->yAxis;
    CustomBars *pCusbars = new CustomBars(xAxis, yAxis);

    pCusbars->setName("Cusbars");
    pCusbars->setPen(QPen(QColor(0, 0, 0).lighter(150))); //设置柱状图的边框颜色
    pCusbars->setBrush(QColor(61, 133, 198)); //设置柱状图背景颜色

    QSharedPointer<QCPAxisTickerText> textTicker(new QCPAxisTickerText);

    textTicker->addTicks(graphPara.VecX, graphPara.VecXLabels);
    xAxis->setTicker(textTicker); //设置为文字轴
    xAxis->setTickLabelRotation(50); //轴刻度文字旋转50度
    xAxis->setSubTicks(true); //显示子刻度
    xAxis->setTickLength(0, 4); //轴内外刻度的长度分别是0,4
    xAxis->setRange(0, 13); //设置x轴范围
    xAxis->setLabel("X");
    xAxis->setUpperEnding(QCPLineEnding::esSpikeArrow); //设置轴顶端箭头

    yAxis->setRange(0, 13); //设置y轴范围
    yAxis->setPadding(35); //轴的内边距
    yAxis->setLabel("y");
    yAxis->setUpperEnding(QCPLineEnding::esSpikeArrow);

    pCusbars->setData(graphPara.VecX, graphPara.VecY);
}
注意:removeDataBefore已经不被支持,需要在qcustomplot.h和qcustomplot.cpp中添加
custombars.h
#ifndef CUSTOMBARS_H
#define CUSTOMBARS_H

#include "qcustomplot.h"

class CustomBars : public QCPBars
{
public:
    explicit CustomBars(QCPAxis *keyAxis, QCPAxis *valueAxis);

    //设置文字对齐方式
    void setTextAlignment(Qt::Alignment alignment);
    Qt::Alignment textAligment() const;

    //设置文字与柱状图的间距
    void setSpacing(double spacing);
    double spacing() const;

    //设置字体
    void setFont(const QFont &font);
    QFont font() const;

protected:
    Qt::Alignment m_textAlign;
    double m_spacing;
    QFont m_font;

    virtual void draw(QCPPainter *painter) Q_DECL_OVERRIDE;
};

#endif // CUSTOMBARS_H
custombars.cpp
#include "custombars.h"

CustomBars::CustomBars(QCPAxis *keyAxis, QCPAxis *valueAxis)
    : QCPBars (keyAxis, valueAxis),
      m_textAlign(Qt::AlignCenter),
      m_spacing(6),
      m_font(QFont(QLatin1String("sans serif"), 12))
{
}

void CustomBars::setTextAlignment(Qt::Alignment alignment)
{
    m_textAlign = alignment;
}

Qt::Alignment CustomBars::textAligment() const
{
    return m_textAlign;
}

void CustomBars::setSpacing(double spacing)
{
    m_spacing = spacing;
}

double CustomBars::spacing() const
{
    return m_spacing;
}

void CustomBars::setFont(const QFont &font)
{
    m_font = font;
}

QFont CustomBars::font() const
{
    return m_font;
}

void CustomBars::draw(QCPPainter *painter)
{
    if (!mKeyAxis || !mValueAxis)
    {
        qDebug() << Q_FUNC_INFO << "invalid key or value axis";
        return;
    }

    if (mDataContainer->isEmpty())
        return;

    QCPBarsDataContainer::const_iterator visibleBegin, visibleEnd;
    getVisibleDataBounds(visibleBegin, visibleEnd);

    QList<QCPDataRange> selectedSegments, unselectedSegments, allSegments;
    getDataSegments(selectedSegments, unselectedSegments);
    allSegments << unselectedSegments << selectedSegments;
    for (int i=0; i<allSegments.size(); ++i)
    {
        bool isSelectedSegment = i >= unselectedSegments.size();
        QCPBarsDataContainer::const_iterator begin = visibleBegin;
        QCPBarsDataContainer::const_iterator end = visibleEnd;
        mDataContainer->limitIteratorsToDataRange(begin, end, allSegments.at(i));
        if (begin == end)
            continue;

        for (QCPBarsDataContainer::const_iterator it=begin; it!=end; ++it)
        {
            //draw bar
            if (isSelectedSegment && mSelectionDecorator)
            {
                mSelectionDecorator->applyBrush(painter);
                mSelectionDecorator->applyPen(painter);
            }
            else
            {
                painter->setBrush(mBrush);
                painter->setPen(mPen);
            }

            applyDefaultAntialiasingHint(painter);
            QRectF barRect = getBarRect(it->key, it->value);
            painter->drawPolygon(barRect);

            //计算文字的位置
            painter->setFont(m_font); //设置字体
            QString text = QString::number(it->value, 'g', 2); //取得当前value轴的值,保留两位精度
            QRectF textRect = painter->fontMetrics().boundingRect(0, 0, 0, 0, Qt::TextDontClip | m_textAlign, text); //计算文字所占用的大小

            if (mKeyAxis.data()->orientation() == Qt::Horizontal) //当key轴为水平轴的时候
            {
                if (mKeyAxis.data()->axisType() == QCPAxis::atTop) //上轴,移动文字到柱状图下面
                    textRect.moveTopLeft(barRect.bottomLeft() + QPointF(0, m_spacing));
                else                                                   //下轴,移动文字到柱状图上面
                    textRect.moveBottomLeft(barRect.topLeft() - QPointF(0, m_spacing));

                textRect.setWidth(barRect.width());
                painter->drawText(textRect, Qt::TextDontClip | m_textAlign, text);
            }
            else //当key轴为竖直轴的时候
            {
                if (mKeyAxis.data()->axisType() == QCPAxis::atLeft)   //左轴,移动文字到柱状图右边
                    textRect.moveTopLeft(barRect.topRight() + QPointF(m_spacing, 0));
                else                                                  //右轴,移动文字到柱状图左边
                    textRect.moveTopRight(barRect.topLeft() - QPointF(m_spacing, 0));

                textRect.setHeight(barRect.height());
                painter->drawText(textRect, Qt::TextDontClip | m_textAlign, text);
            }
        }
    }
}
commondef.h
#ifndef COMMONDEFS_H
#define COMMONDEFS_H

#include <QObject>
#include <QDebug>
#include <QMetaType>
#include <QVector>


#define  MY_DEBUG  qDebug() << "[" << __FILE__ << ":" << __FUNCTION__ << ":" << __LINE__ << "] "
#define  ACT_ENABLE(act, en)  if(act) { act->setEnabled(en);}
#define  SAFE_FREE(p) \
do { \
    if(p) \
    { \
        delete p; \
        p = NULL; \
    } \
} while(0)

typedef struct Graph_Curve_t
{
    double X;
    double Y;
}GRAPH_CURVE_T;

typedef struct Graph__t
{
    QVector<double> VecX;
    QVector<QString> VecXLabels;
    QVector<double> VecY;

}GRAPH_HISTOGRAM_T;

typedef struct Graph_Pie_t
{
    QVector<QString> VecLabels;
    QVector<double> VecValues;

}GRAPH_PIE_T;


#endif
mainwindow.h
#ifndef MAINWINDOW_H
#define MAINWINDOW_H

#include <QMainWindow>
#include "commondef.h"

namespace Ui {
class MainWindow;
}

class MainWindow : public QMainWindow
{
    Q_OBJECT

public:
    explicit MainWindow(QWidget *parent = nullptr);
    ~MainWindow();
    //曲线
    void initCurve();
    //柱状图
    void initHistogram();
    //QCustomPlot不能绘制饼状图

private slots:
    void on_pushButton_CurveStart_clicked();
    void on_pushButton_CurveStop_clicked();
    void on_showCurve();

private:
    Ui::MainWindow *ui;
    QTimer *m_pCurveTimer;
};

#endif // MAINWINDOW_H
mainwindow.cpp
#include "mainwindow.h"
#include "ui_mainwindow.h"
#include "ctcumtomplot.h"
#include <QDateTime>


MainWindow::MainWindow(QWidget *parent) :
    QMainWindow(parent),
    ui(new Ui::MainWindow)
{
    ui->setupUi(this);
    m_pCurveTimer = new QTimer(this);
    connect(m_pCurveTimer, SIGNAL(timeout()),
            this, SLOT(on_showCurve()));

    //动态曲线
    initCurve();

    //柱状图
    initHistogram();
}

MainWindow::~MainWindow()
{
    delete ui;
}

/***********************
*动态曲线
************************/
void MainWindow::initCurve()
{
    CtCumtomPlot::getInstance().CreateRealCurve(ui->widget_Tab1);
}

void MainWindow::on_showCurve()
{
    //随机数种子
    //qsrand(QTime(0, 0, 0).secsTo(QTime::currentTime()));

    GRAPH_CURVE_T CurveParam;
    CurveParam.X = QTime::currentTime().hour()*60*60 + QTime::currentTime().minute()*60 + QTime::currentTime().second();
    //MY_DEBUG << "m_graphParam.X:" << m_graphParam.X;

    double tmp = static_cast<double>(rand() % (1000) + 2000);
    CurveParam.Y = static_cast<double>(rand() % (1000) + tmp);

    CtCumtomPlot::getInstance().setCurve(CurveParam);
}

void MainWindow::on_pushButton_CurveStart_clicked()
{
    m_pCurveTimer->start(1000);
}

void MainWindow::on_pushButton_CurveStop_clicked()
{
    m_pCurveTimer->stop();
}

/***********************
*柱状图
************************/
void MainWindow::initHistogram()
{
    //X轴
    GRAPH_HISTOGRAM_T HistogramParam;
    HistogramParam.VecX << 1 << 2 << 3 << 4 << 5 << 6 << 7 << 8 << 9 << 10 << 11 << 12;
    HistogramParam.VecXLabels << "Jan" << "Feb" << "Mar" << "Apr" << "May" <<
                              "Jun" << "Jul" << "Aug" << "Sep" << "Oct" <<
                              "Nov" << "Dec";
    //Y轴
    QTime randtime;
    randtime = QTime::currentTime();
    qsrand(randtime.msec()+randtime.second()*1000); //以当前时间ms为随机种子
    for(int i = 0; i < 12; i++)
    {
        int nVal = qrand() % 100;        //产生100以内的随机整数
        double dVal = double(nVal)/10;   //产生10以内的随机浮点数,精度为小数点后1位

        HistogramParam.VecY << dVal;
    }

    //创建柱状图
    CtCumtomPlot::getInstance().CreateHistogram(ui->widget_Tab2, HistogramParam);
}
3.demo工程下载:
下载地址: https://download.csdn.net/download/linyibin_123/87388205
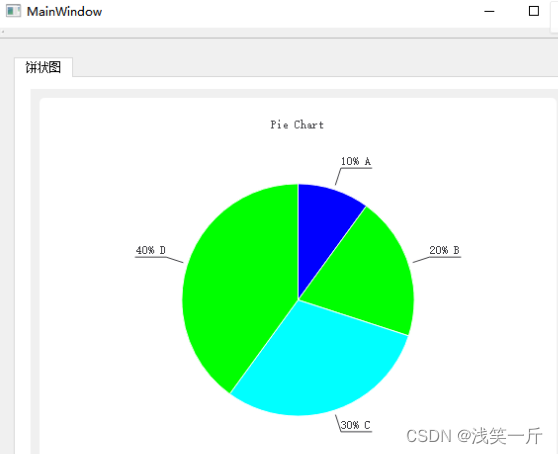
五、QtCharts的使用
使用QtCharts封装饼状图:
1.界面
2.核心代码
注意:
1)pro中需要添加
QT += charts
2)界面处理:
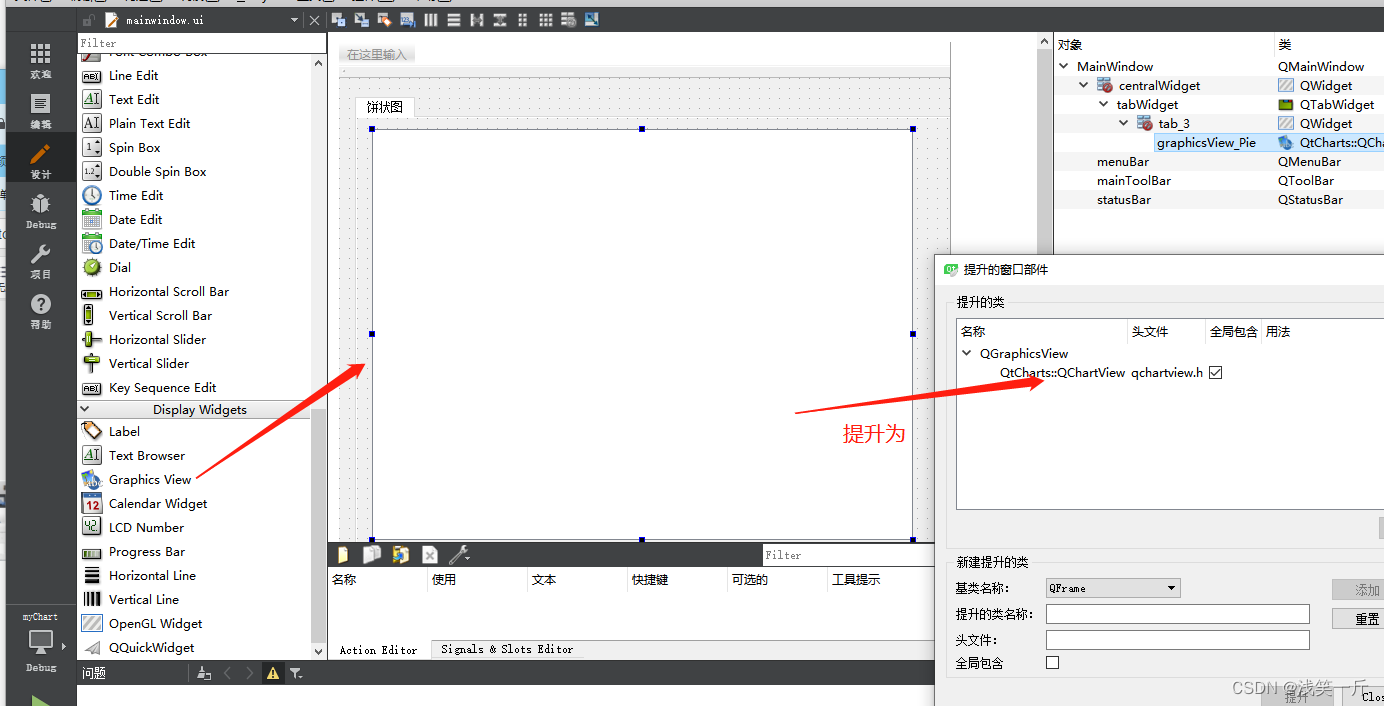
ctchart.h
#ifndef CTCHART_H
#define CTCHART_H

#include <QObject>
#include <QChar>
#include <QtCharts/QChartView>
#include <QValueAxis>
#include <QValueAxis>
#include <QtCharts/QPieSeries>
#include <QtCharts/QPieSlice>
#include "commondef.h"

QT_CHARTS_USE_NAMESPACE

class ctChart : public QObject
{
    Q_OBJECT
public:
    explicit ctChart();
    ~ctChart();

    static ctChart& getInstance();

    void createPie(QChartView *pGraphView, GRAPH_PIE_T stPie);

private:
    QChart* m_pChart;
};

#endif // CTCHART_H
ctchart.cpp
#include "ctchart.h"

ctChart::ctChart()
{
}

ctChart::~ctChart()
{
}

ctChart &ctChart::getInstance()
{
    static ctChart s_obj;
    return s_obj;
}

void ctChart::createPie(QChartView *pGraphView, GRAPH_PIE_T stPie)
{
    QChart *pChart = new QChart();
    QPieSeries *pSeries = new QPieSeries();

    for(int i = 0; i < stPie.VecValues.size(); i++)
    {
        //饼状分区
        QPieSlice* pSlice = new QPieSlice(stPie.VecLabels.at(i), stPie.VecValues.at(i), this);
        pSlice->setLabelVisible(true);
        pSlice->setBrush(stPie.VecColor.at(i));

        //饼状分区加入series
        pSeries->append(pSlice);
    }
    pSeries->setLabelsVisible(true);

    //添加pSeries到QChart
    pChart->addSeries(pSeries);

    //设置显示时的动画效果
    pChart->setAnimationOptions(QChart::AllAnimations);
    pChart->setTitle("Pie Chart");

    //不显示图描述
    pChart->legend()->hide();

    pGraphView->setChart(pChart);

    pGraphView->setRenderHint(QPainter::Antialiasing);
}
commondef.h
#ifndef COMMONDEFS_H
#define COMMONDEFS_H

#include <QObject>
#include <QDebug>
#include <QMetaType>
#include <QVector>


#define  MY_DEBUG  qDebug() << "[" << __FILE__ << ":" << __FUNCTION__ << ":" << __LINE__ << "] "
#define  ACT_ENABLE(act, en)  if(act) { act->setEnabled(en);}
#define  SAFE_FREE(p) \
do { \
    if(p) \
    { \
        delete p; \
        p = NULL; \
    } \
} while(0)

typedef struct Graph_Curve_t
{
    double X;
    double Y;
    int nYMinRange;
    int nYMaxRange;
}GRAPH_CURVE_T;

typedef struct Graph_Histogram_t
{
    QVector<double> VecX;
    QVector<QString> VecXLabels;
    QVector<double> VecY;

}GRAPH_HISTOGRAM_T;

typedef struct Graph_Pie_t
{
    QVector<QString> VecLabels;
    QVector<double> VecValues;
    QVector<QColor> VecColor;

}GRAPH_PIE_T;


#endif
mainwindow.h
#ifndef MAINWINDOW_H
#define MAINWINDOW_H

#include <QMainWindow>
#include "ctchart.h"

namespace Ui {
class MainWindow;
}

class MainWindow : public QMainWindow
{
    Q_OBJECT

public:
    explicit MainWindow(QWidget *parent = nullptr);
    ~MainWindow();

    void initPie();

private:
    Ui::MainWindow *ui;
};

#endif // MAINWINDOW_H
mainwindow.cpp
#include "mainwindow.h"
#include "ui_mainwindow.h"
#include <QDateTime>
#include <QTimer>

MainWindow::MainWindow(QWidget *parent) :
    QMainWindow(parent),
    ui(new Ui::MainWindow)
{
    ui->setupUi(this);

    initPie();
}

MainWindow::~MainWindow()
{
    delete ui;
}

void MainWindow::initPie()
{
    GRAPH_PIE_T graphPie;
    graphPie.VecLabels.append("10% A");
    graphPie.VecLabels.append("20% B");
    graphPie.VecLabels.append("30% C");
    graphPie.VecLabels.append("40% D");

    graphPie.VecValues.append(10);
    graphPie.VecValues.append(20);
    graphPie.VecValues.append(30);
    graphPie.VecValues.append(40);

    graphPie.VecColor.append(QColor(0,0,255,255));
    graphPie.VecColor.append(QColor(0,255,0,255));
    graphPie.VecColor.append(QColor(0,255,255,0));
    graphPie.VecColor.append(QColor(0,255,0,0));

    ctChart::getInstance().createPie(ui->graphicsView_Pie, graphPie);
}
3.demo工程下载
https://download.csdn.net/download/linyibin_123/87388205